Feeling the Heat
Reimagining Heatwave Broadcast Graphics
Company
AccuWeather
Role
Art Director
Sole designer on the heatwave graphics reimagining, a focused brief within the broader broadcast system I built for the network. Responsible for all design decisions from information hierarchy through production-ready execution.
Data Visualization
Broadcast Graphics
Accessibility
Information Design
AccuWeather's heatwave graphics had a data problem. They were showing too much of it, overwhelming viewers. My job was to simplify and align the visuals to brand standards.
Inherited Graphics
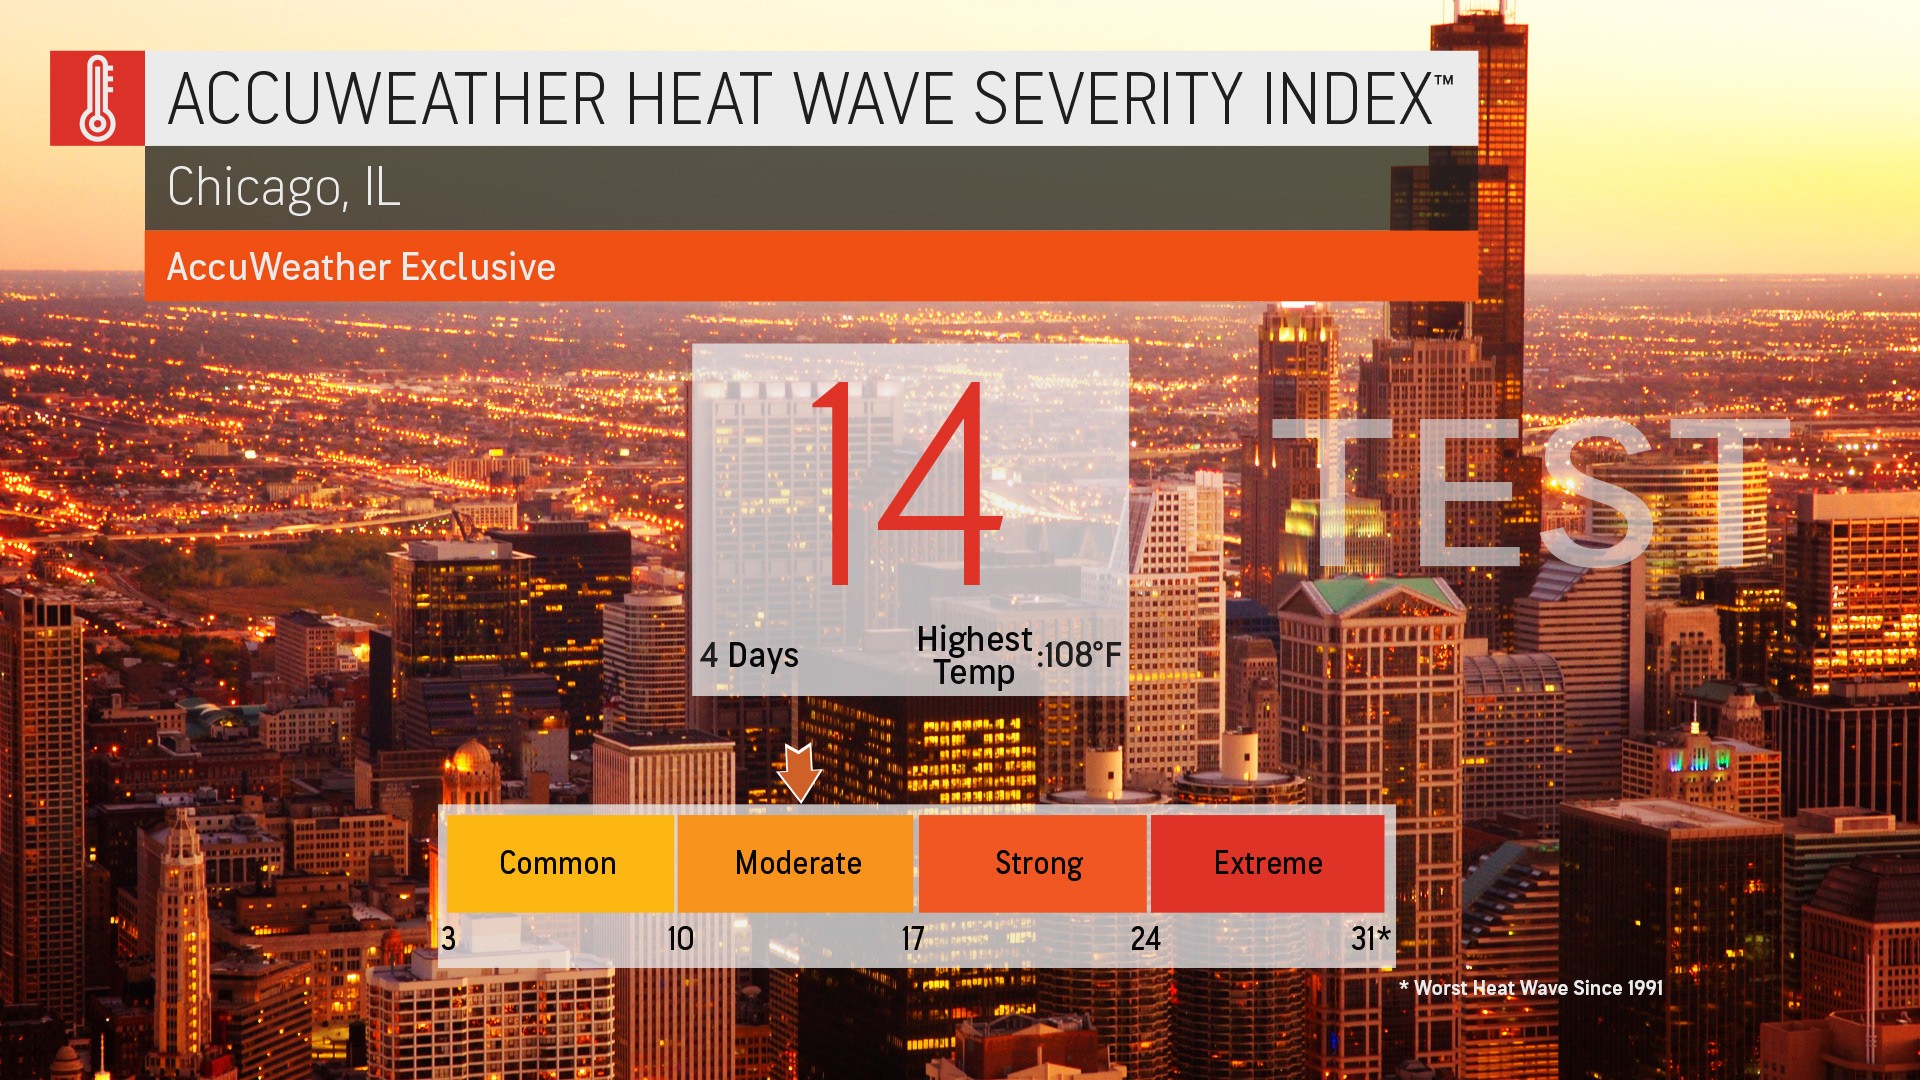
The Heat Wave Severity Index was a proprietary score combining duration and intensity into a single number. It was a genuinely useful tool, and the design failed to communicate it. The original graphics added explanatory screens, a bar chart, and a comparative ranking table, each requiring viewers to hold context from the previous one. On a live broadcast, that context disappears the moment the screen changes.

The Redesign
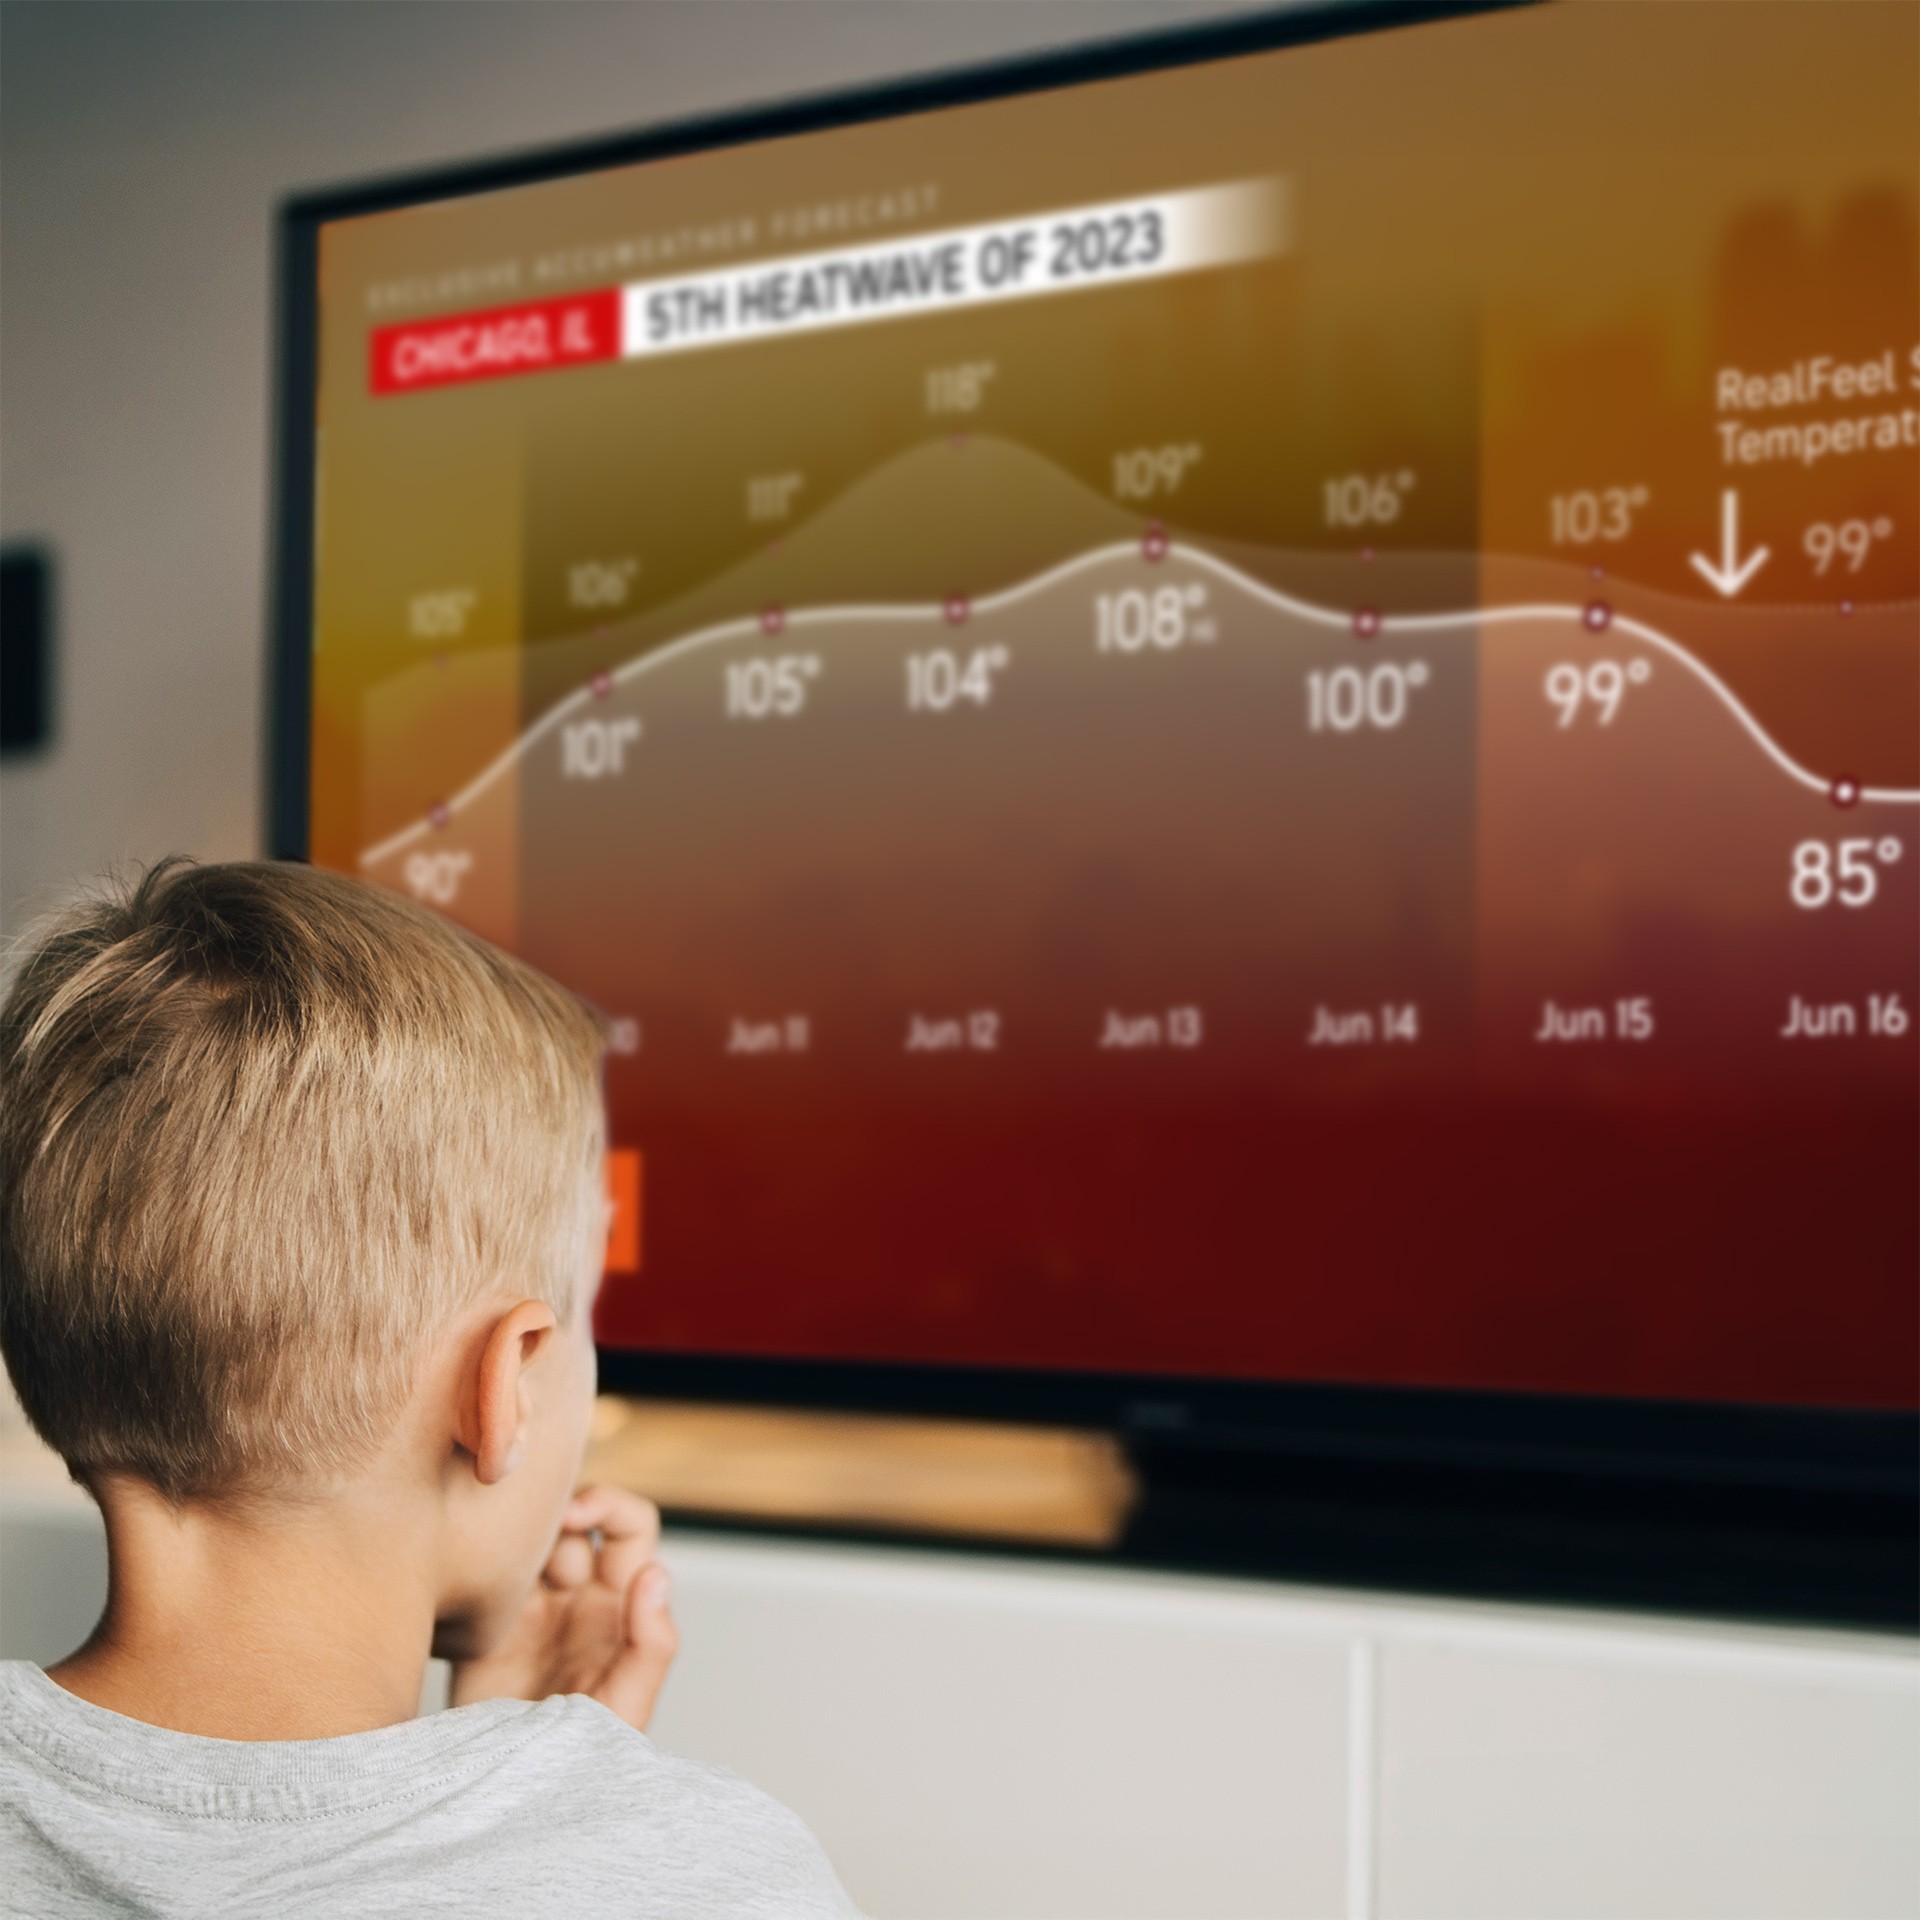
Warm amber-to-deep-red photographic backgrounds that make the screen feel like the subject. A dual-line temperature curve: forecast high as a solid white line, RealFeel Sun as a dotted line above it. Behind them, the gradient darkens through the peak days and lifts as temperatures fall. The arc of the event is visible at a glance. The rankings table replaces raw index scores with color-coded severity labels drawn from AccuWeather's existing danger scale. Viewers already know it from severe weather coverage.


Challenge
The original graphics tried to introduce, explain, and apply a proprietary severity index all at once. Technically accurate. Practically unreadable on a live broadcast.
Solution
Build the comparison into the visual structure itself. Viewers should see how the heat wave stacks up at a glance, without having to learn an unfamiliar scoring system.